

Understanding Trading Brokers in Nigeria
Discover how trading brokers connect Nigerian traders to markets, their key services, account types, useful tips, and local regulations to trade smarter 💹📊
Edited By
Charlotte Hughes
Fibonacci retracement stands as one of the key tools traders and investors use to anticipate possible market turning points. At its heart, it relies on ratios derived from the famous Fibonacci sequence—a series of numbers where each is the sum of the two preceding ones. These ratios help identify price levels where an asset might find support or resistance after a significant move.
In practice, when a stock or currency pair experiences a noticeable up or downtrend, traders plot horizontal lines at key Fibonacci levels—commonly 23.6%, 38.2%, 50%, 61.8%, and sometimes 78.6%. These lines suggest where price could pause, reverse, or continue. For example, on the Nigerian Exchange (NGX), a stock like Dangote Cement might pull back from a recent high; plotting Fibonacci retracement could highlight ₦2,300 as a strong support level around the 61.8% retracement.
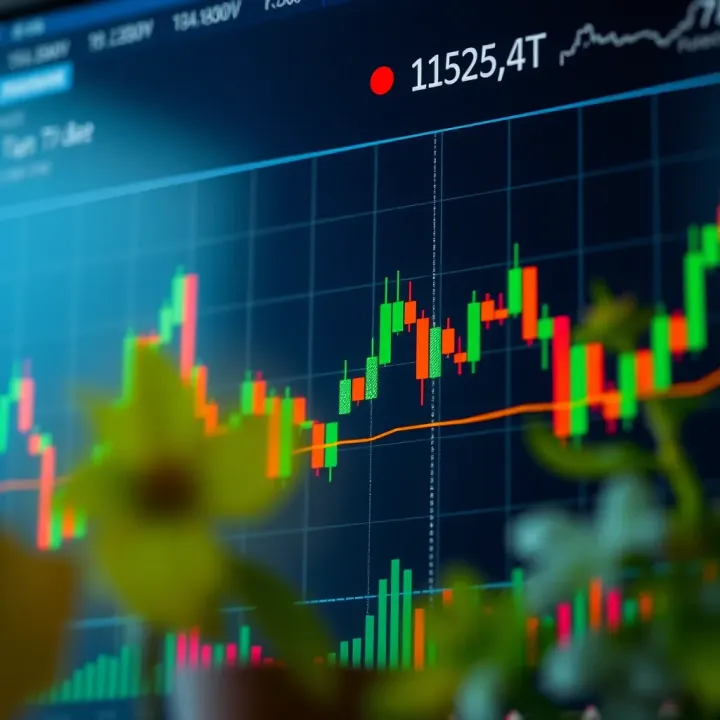
Understanding how to apply Fibonacci retracement requires observing actual price swings rather than relying on arbitrary points. You start by selecting the most recent significant low and high on the chart. The retracement levels then project potential correction zones assuming the trend might resume after a pause.
"Fibonacci retracement isn't a crystal ball, but it guides you where traders may step in or out, making it powerful when combined with other analysis like volume or candlestick patterns."
For Nigerian forex traders dealing with pairs like USD/NGN, using Fibonacci retracement can pinpoint crucial levels where the naira's value might bounce or stall amid volatile currency market moves.
Key practical points:
Identify a clear swing high and swing low on your price chart.
Use Fibonacci ratios to draw horizontal lines between these points.
Watch price action closely around these levels for confirmation.
Combine retracement with trend indicators or volume to avoid false signals.
Fibonacci retracement works best as part of a broader toolkit—no single method guarantees success. Yet, its simplicity and widespread use make it valuable for Nigerian traders and investors looking to understand potential price behaviour in both local stocks and global markets.
Fibonacci retracement is a key tool in technical analysis that helps traders and investors spot potential points where a price trend might pause or reverse. It’s especially popular because it offers clear visual levels on charts, enabling practical decision-making for entries, exits, or stop-loss placements. For markets like the Nigerian Stock Exchange or Forex trading involving the naira, understanding these levels can help navigate the frequent market swings caused by volatility and external shocks.
Using Fibonacci retracement means recognising patterns in price movements that align with specific percentages derived from the Fibonacci sequence. These levels often coincide with real support or resistance zones, making the tool handy for planning trades or managing risk without relying purely on gut feeling or random guesswork.
The Fibonacci sequence dates back to the 13th century thanks to Leonardo of Pisa, also called Fibonacci. He observed a numerical pattern where each number is the sum of the two preceding ones: 0, 1, 1, 2, 3, 5, 8, and so forth. This simple sequence surprisingly appears in many natural and human-made systems, from flower petals to snail shells, due to its unique mathematical properties.
In financial markets, traders found that price movements often retrace or pull back by ratios derived from Fibonacci numbers. These ratios create a framework where prices tend to find support or resistance, reflecting human behaviour and market psychology. For example, after a rally, a stock price might pull back by about 38.2% or 61.8% before continuing its trend, patterns that emerge repeatedly on different time frames.
The main retracement ratios used in trading are 23.6%, 38.2%, 50%, 61.8%, and 78.6%. These percentages aren’t random; they come from the mathematical relationships within the Fibonacci sequence. For instance, 61.8% represents the golden ratio, often found in nature and art. The 50% level is not a Fibonacci number but is popular due to behavioural finance reasons, showing a natural halfway correction.
Traders draw these Fibonacci levels between a significant price high and low on a chart. Imagine a stock climbing from ₦200 to ₦300 before pulling back; the retracement tool calculates prices at these key percentages of that ₦100 move (such as around ₦261.80 at 61.8%, or ₦238.20 at 23.6%), plotting horizontal lines. These lines then act as potential support or resistance points, guiding the trader on where price could stall or change direction.
Using Fibonacci retracement gives traders a tried-and-tested visual guide for anticipating price behaviours, which is invaluable when markets move fast or lack clear direction.
By learning the origins and calculations, traders in Nigerian markets can apply Fibonacci retracement effectively, tailored to different assets and timescales for better trading strategies.
Fibonacci retracement is a vital tool for technical traders because it helps identify possible turning points in price movements. When applied correctly, it reveals zones where price might reverse or pause, crucial for planning entry and exit in trades. Given the often volatile nature of markets, particularly in Nigeria where forex and equities can react sharply to economic news, using Fibonacci retracement adds an extra layer of precision.
Traders rely on Fibonacci levels, such as 38.2%, 50%, and 61.8%, to spot where prices may pull back before continuing their trend. For example, if a stock on the Nigerian Stock Exchange (NGX) rises sharply from ₦50 to ₦100, traders observe the retracement levels to estimate where price may find support, say around ₦81.80 (61.8% level). Recognising this helps traders position themselves early for a potential bounce rather than chasing prices at highs.
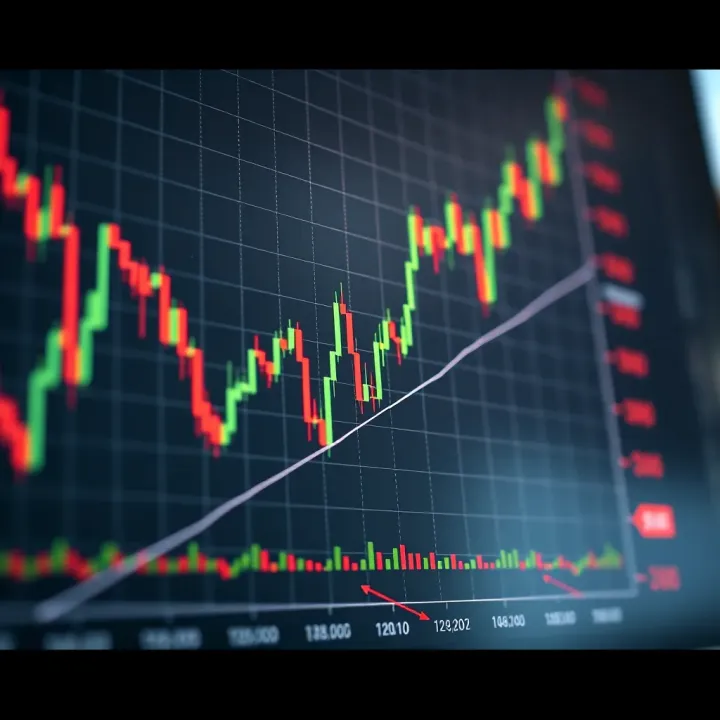
Reversal zones also help in spotting market hesitation. When prices reach these key Fibonacci levels and show signs like candlestick patterns or volume increases, it suggests traders are considering a change. This insight can prevent needless losses from late entries or exits.
Fibonacci retracement lines provide natural points for risk management. For instance, placing a stop-loss a few pips beyond a Fibonacci support level limits downside risk if the price breaks through. Likewise, using the retracement levels as take-profit targets allows for systematic exits aligned with market behaviour.
Imagine trading forex pairs like USD/NGN where volatility is high; Fibonacci levels offer structured places to set stop-losses and lock profits. This approach avoids emotional decisions and supports safer trading, especially when combined with proper position sizing.
Fibonacci retracement works best when combined with other indicators. Moving averages can confirm the overall trend direction, helping filter false reversal signals from Fibonacci levels. For instance, if the price hits the 50% retracement but remains above the 20-day moving average, it suggests the uptrend is still intact.
Relative Strength Index (RSI) and Moving Average Convergence Divergence (MACD) provide momentum insights. If the price touches a Fibonacci level while RSI indicates oversold conditions or MACD shows bullish crossover, it strengthens the case for a reversal. Such alignment improves trade timing and confidence.
Relying only on Fibonacci levels can mislead traders. Prices may briefly cross these lines due to temporary volatility, triggering premature trade decisions. Confirming Fibonacci retracements with volume spikes or chart patterns such as double bottoms or head and shoulders reduces the risk of false signals.
Moreover, in Nigerian markets with sometimes low liquidity and sudden moves caused by news (like naira devaluation), it's key to combine Fibonacci analysis with broader market context. This layered approach prevents over-trading and aligns trades with real market momentum.
Using Fibonacci retracement without other indicators is like driving blindfolded—you might get lucky once, but consistent success demands a clear view from different angles.
In summary, integrating Fibonacci retracement with other technical tools and meticulous risk settings helps you navigate market swings effectively. It turns guesswork into strategy, particularly in markets as dynamic as Nigeria’s.
Fibonacci retracement holds growing importance for traders and investors navigating Nigerian financial markets. These tools help identify potential support and resistance levels, which is vital in an environment where price swings can be unpredictable due to local economic factors. Understanding how Fibonacci levels work within the context of Nigerian equities and forex can improve timing and risk management for market participants.
The Nigerian Stock Exchange (NGX) offers diverse opportunities for applying Fibonacci retracement. For instance, stocks like Dangote Cement or MTN Nigeria often exhibit price movements where retracement levels can mark probable pullback zones during trending periods. A trader following Dangote Cement between ₦190 to ₦215 might find the 38.2% or 61.8% retracement levels useful to pinpoint entry points after price corrections.
In the forex market, pairs involving the naira (NGN) such as USD/NGN present ample volatility. Here, Fibonacci retracement can help forex traders estimate where the naira might strengthen or weaken after sharp moves, aiding in setting stop-loss or profit targets. For example, during bouts of naira depreciation caused by FX shortages, retracement zones often signal areas where the price could stabilise temporarily before the next movement.
Currency fluctuations sharply influence price action on NGX and in the forex market. The naira’s volatility, often driven by factors like oil revenue changes or CBN's monetary policy interventions, means retracement levels may shift faster than in more stable markets. Traders need to adapt by monitoring broader economic data alongside Fibonacci levels to avoid mistaking noise for meaningful support or resistance.
Moreover, market volatility in Nigeria sometimes leads to sudden price spikes or drops, triggered by events such as petrol scarcity or political announcements. These sharp moves can cause false breakouts through Fibonacci levels. Hence, practitioners often combine retracement with volume analysis or other indicators to confirm signals.
Liquidity remains limited in many Nigerian stocks, especially mid and small-cap equities. This low market depth can distort price movements, making Fibonacci retracement levels less reliable at times. For example, a thinly traded stock might jump past a retracement level quickly without the usual pauses or reversals that confirm support or resistance.
Retail traders often need to be cautious using Fibonacci in such instruments. Adapting analysis to more liquid stocks or using longer time frames helps reduce false signals. In contrast, blue-chip stocks and forex pairs with relatively higher liquidity respond better to retracement strategies.
In Nigeria, many retail investors trade based on quick news reactions or short-term trends tied to economic or political events. Such behaviours can lead to erratic price moves that don’t always respect classical Fibonacci zones. Consequently, traders often adapt by:
Combining Fibonacci retracement with awareness of local market sentiment and news
Using broader retracement zones instead of strict levels to accommodate volatility
Confirming signals with other tools like moving averages or Relative Strength Index (RSI)
Using Fibonacci retracement in Nigerian markets demands flexibility and a deep understanding of local trading dynamics. When combined with other techniques and awareness of market conditions, it becomes a powerful addition to a trader’s toolbox.
This practical approach helps avoid the pitfall of relying blindly on Fibonacci levels and instead focuses on their role as part of a wider technical analysis strategy suited for Nigeria’s unique market environment.
Applying Fibonacci retracement without a clear method can lead to confusion or missed opportunities in trading. This section breaks down practical steps that traders and investors can follow to increase precision and confidence when interpreting retracement levels. Knowing how to choose the right time frames, target assets, and correctly plot swing points greatly improves the reliability of this tool in both Nigerian and global markets.
When deciding on time frames for Fibonacci analysis, the key is matching your trading style. Short-term traders focusing on intraday or few-days patterns should use hourly or 15-minute charts. This granularity captures quick price swings common in forex pairs like USD/NGN or popular NGX stocks such as Dangote Cement. On the other hand, long-term investors analysing position trades may prefer daily or weekly charts to spot broader trends and retracement points that matter over months.
The choice of asset class matters as well. Fibonacci retracement works effectively across stocks, forex, and commodities, but behaviours differ. Nigerian equities tend to show retracements around major economic news or market sentiment shifts, often influenced by naira volatility. Forex markets, especially emerging pairs involving the naira, exhibit more frequent retracement levels due to liquidity and FX interventions. Commodities like Nigerian crude oil can display clearer retracement zones linked to global supply shocks and OPEC announcements. Understanding these dynamics helps you set realistic expectations and adapt your retracement application accordingly.
Picking the right swing highs and lows forms the foundation of effective retracement analysis. Start by identifying significant peaks and troughs on your chart where prices have clearly reversed direction—avoid minor price jitters caused by daily noise. For example, for a NTEL share price chart, note the highest price point before a steady decline as your swing high, and the lowest point after that decline as your swing low. This method ensures your retracement lines reflect meaningful market sentiment shifts.
Reading retracement levels is about spotting potential support or resistance zones where price may pause or reverse. Once levels such as 38.2%, 50%, and 61.8% are drawn, watch out for price action signals around these lines. If the price pulls back to the 61.8% level and starts showing consolidation or bullish patterns, it can be a good indication of a rebound or buying opportunity. Conversely, failure to hold retracement levels may signal further movement in the original trend’s direction. Combining this insight with volume or momentum indicators further sharpens your reading of these zones.
Correctly applying Fibonacci retracement enhances your ability to time entries and exits, manage risks, and interpret market sentiment with more clarity and confidence.
Understanding both the strengths and limitations of Fibonacci retracement is essential for traders and investors aiming to use it effectively. While it offers clear advantages, overlooking its boundaries can lead to misjudgments in market decisions.
Simple application and visual clarity: One key strength of Fibonacci retracement lies in its straightforward use. Traders can quickly draw the levels between significant price points — typically a swing high and low — on their charts and immediately see key potential support and resistance zones. This visual clarity makes it easier to anticipate where prices might pause or reverse, without needing complex calculations or indicators.
For example, a trader on the Nigerian Stock Exchange (NGX) might spot that the price of Dangote Cement retraced roughly 61.8% after a strong rally, signalling a potential buying opportunity. This helps in making quick, confident decisions, especially in fast-moving markets where complex analysis isn’t always practical.
Helps manage risk through defined levels: Fibonacci levels act as natural checkpoints for setting stop-loss and take-profit orders. With these clear lines, traders know where the market might encounter buying or selling pressure, allowing better risk control.
If a forex trader is dealing with USD/NGN and observes a retracement near the 50% level, they can position their stop-loss just below this point. Doing so limits potential losses without guessing blindly. Likewise, take-profit targets can be set near the next Fibonacci level, helping to lock in profits systematically and avoiding emotional decisions.
Over-reliance on Fibonacci levels alone: A common mistake is trusting Fibonacci retracement as a standalone tool. Markets rarely behave according to theory alone; price action is influenced by various factors including volume, news, and broader economic events. Relying solely on Fibonacci levels may cause traders to overlook these important dynamics and enter or exit trades prematurely.
For instance, if a trader on the NGX bases their action just on a 38.2% retracement level but ignores significant economic news affecting naira exchange rates, they might experience unexpected losses. It’s vital to combine Fibonacci with other indicators like moving averages or market fundamentals to confirm signals.
Variability and subjectivity in interpretation: Drawing Fibonacci levels depends on selecting the correct swing highs and lows. However, traders often identify different points depending on their approach, leading to inconsistent results. This subjectivity means one trader’s signal might contradict another’s, creating confusion.
For example, two analysts looking at the same MTN Nigeria chart might pick slightly different peaks and troughs, resulting in different retracement zones. Traders must therefore develop experience to choose relevant points and combine Fibonacci analysis with market context rather than treating the levels as absolute.
Using Fibonacci retracement wisely means appreciating its visual simplicity and risk management benefits while recognising its limitations as a subjective tool that works best alongside other methods.
Discover how trading brokers connect Nigerian traders to markets, their key services, account types, useful tips, and local regulations to trade smarter 💹📊
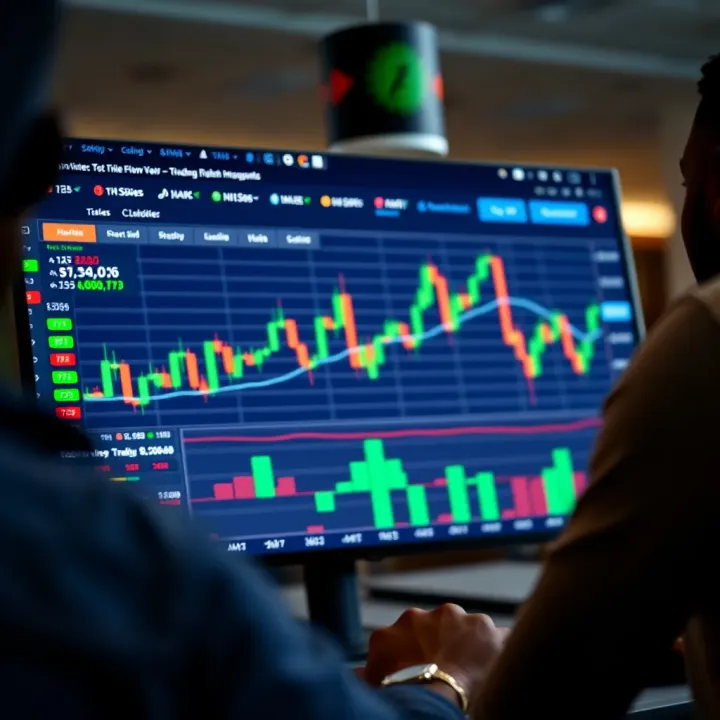
📈 Discover how the best trading platforms help Nigerian investors access stocks, forex, and commodities securely with local market insights and reliable features.
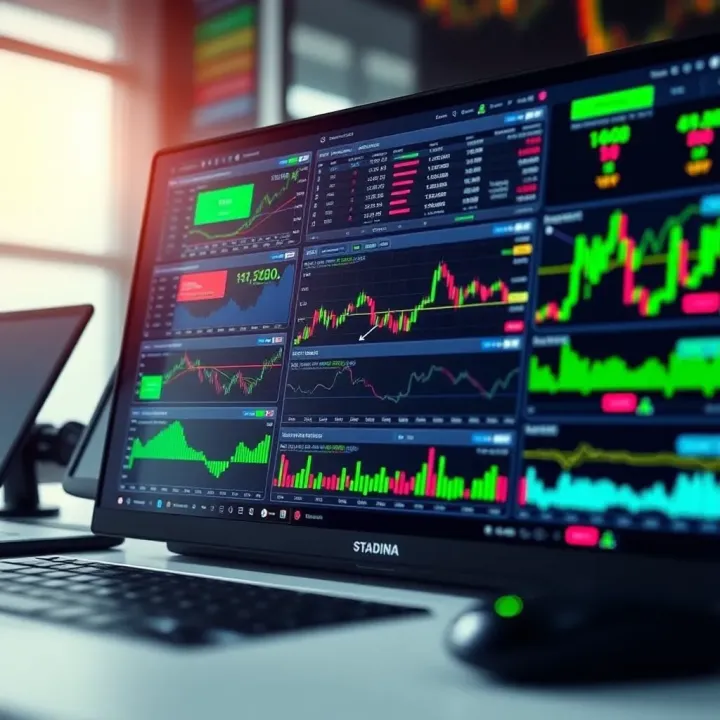
Ready to trade online in Nigeria? 📈 Learn practical steps, popular platforms, risk tips, and legal must-know facts to trade confidently and grow your ₦ safely.
Explore synthetic trading concepts & applications 📈. Learn how Nigerian traders use synthetic positions to manage risks & maximize opportunities in markets.
Based on 14 reviews